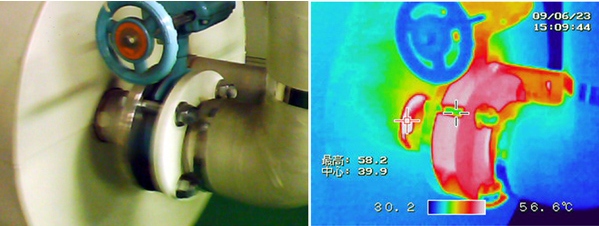
サーモグラフィ | 用途・事例
可視光画像と比較し不具合を解析
可視画像と比較することで、どの部位に異常があるかの判断が容易にできます
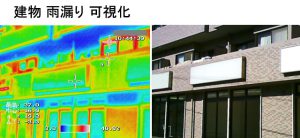
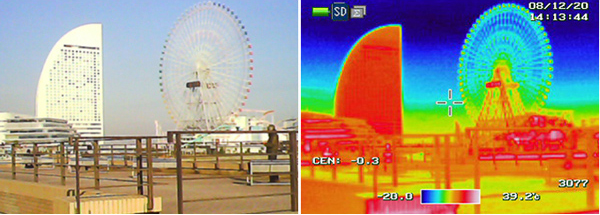
サンプル 1(建物) [熱がこもる場所を特定]
建物などへの熱環境を可視化
![](http://asanuma1871.cms.future-shop.jp/sanki/wp-content/uploads/2019/12/sample-1.jpg)
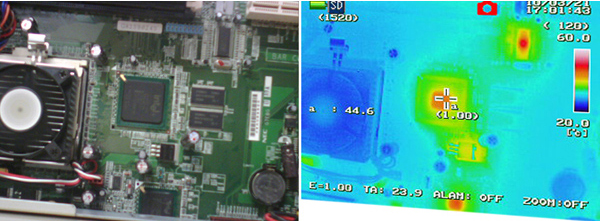
サンプル 2 (パソコン基板) [半導体素子の熱負荷を検討]
負荷などにより熱暴走原因究明を可視化
![](http://asanuma1871.cms.future-shop.jp/sanki/wp-content/uploads/2019/12/sample-2.jpg)
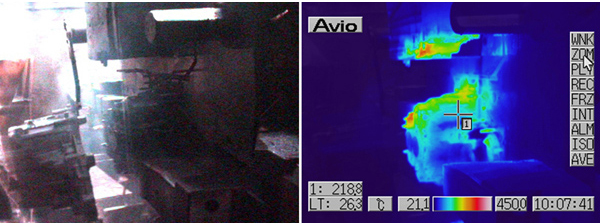
サンプル 3 (ダイカスト金型) [金型寿命対策 不具合検討]
熱により金型破損などを監視し冷却のタイミングを可視化
![](http://asanuma1871.cms.future-shop.jp/sanki/wp-content/uploads/2019/12/sample-3.jpg)
サンプル 4 (給湯タンクバルブ) [温度上昇箇所の監視]
温度上昇を可視化
![](http://asanuma1871.cms.future-shop.jp/sanki/wp-content/uploads/2019/12/sample-4.jpg)
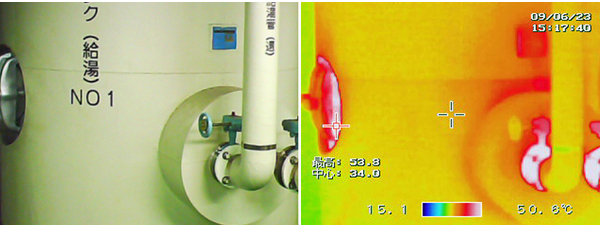
サンプル 5 (給湯タンクバルブ2) [近接撮影]
![](http://asanuma1871.cms.future-shop.jp/sanki/wp-content/uploads/2019/12/sample-5.jpg)